-
Hey everyone, staff have documented a list of banned content and subject matter that we feel are not consistent with site values, and don't make sense to host discussion of on Famiboards. This list (and the relevant reasoning per item) is viewable here.
You are using an out of date browser. It may not display this or other websites correctly.
You should upgrade or use an alternative browser.
You should upgrade or use an alternative browser.
StarTopic Future Nintendo Hardware & Technology Speculation & Discussion |ST| (Read the staff posts before commenting!)
- Thread starter Dakhil
- Start date
Threadmarks
View all 18 threadmarks
Reader mode
Reader mode
Recent threadmarks
Poll #3: When do you think is the launch window for Nintendo's new hardware? Announcement regarding links to news and rumours from 2022 and 2021 Rough summary of the 2 August 2023 episode of Nate the Hate Rough summary of the 11 September 2023 episode of Nate the Hate Anatole's deep dive into a convolutional autoencoder Differences between T234 and T239 Rough summary of the 19 October 2023 episode of Nate the Hate necrolipe's Twitter (X) post on why a 2025 launch doesn't automatically make T239 outdated based on one of the leaked slides from Microsoft
Staff Communication
View all 13 threadmarks
Reader mode
Reader mode
Recent threadmarks
Staff Communication 05/26/23 Staff Post about Citing Leaks and Rumors Staff Post about reading Hidden Content Staff Post- Please read Keeping on topic New Switch 2 ST Made - Nontechnical Talk Has A New Home Staff Post Regarding Dubious Insiders And Better Sourcing Reminder about hide tags NewZ0m3le
Bob-omb
I think MVG was just trying to point out that T239 isn't for Nintendo, and in a vacuum, can easily do that as Linux and Nintendo Switch "2" won't be connected regardless of the hardware... It's why I keep attacking MVG's position, it's misleading.I wasn't expecting any Linux kernel related info to link to Nintendo, since anything Nintendo related would be closed-source and proprietary. If we managed to get Nintendo specific information from it, that'd be a big mistake on their part.
SiG
Chain Chomp
I think it's good the greater public is ignoring most of these smaller info dumps for now. Let everyone get surprised when they finally announce the actual hardware.I'd assume he knows but since it suggests but doesn't proof it, he mentioned it only proofed the 8 core CPU.
From what I see Nate is very explicitly trying not to indulge in Switch Next rumors but only comment on actual findings / facts right now.
Which is what is leading to confusion, because it gets interpreted as him negating anything that is not confirmed but conclusive.
I think he can only make up for it by leaking the release date now!
Serif
𝕽𝖊𝖓𝖊𝖌𝖆𝖉𝖊 𝕬𝖓𝖌𝖊𝖑
I peeled back through the thread, since only a few (or maybe just one) member(s) got to actually look inside the data breach, I wanted to find notes where T239 is referenced specifically in relation to NVN2. I'm confident T239 is the chip, and I already know T239 was in the leak, but out of my own nitpicky nature I wanted to see details. Judging from what's been observed, NVN2 is intended to run on Drake i.e. T239. On some level I've known this because I've read these posts before (the second one was only two weeks ago), but it's a good refresher.I think MVG was just trying to point out that T239 isn't for Nintendo, and in a vacuum, can easily do that as Linux and Nintendo Switch "2" won't be connected regardless of the hardware... It's why I keep attacking MVG's position, it's misleading.
Yes, Drake is from the Nvidia leak. It's used in several places and very clearly so, and there are even places that spell it out explicitly like this:
C++:// Ampere Tegra GA10B (T234 / Orin) GLSLC_CHIP_TYPE_AMPERE_TEGRA_GA10B = 0x00000004, // Ampere Tegra GA10F (T239 / Drake) GLSLC_CHIP_TYPE_AMPERE_TEGRA_GA10F = 0x00000008,
As the only person in this thread (afaik) who's actually looked at the leak, let me assure you that there is zero doubt that the GPU called GA10F was being designed with 12 SMs (thus 1536 CUDA) and that NVN2 was intended to run on it. The 12 SM number isn't just from one place, or just "in the API" as some tend to characterize it. It's all over the place in drivers, metadata, diagnostic checks, the works. It adds up when you look at the other numbers (GPC count * TPC count * SMs per TPC * CUDA per SM) that are also all over the place. It's one of the best supported pieces of evidence in there both inside and outside the Nintendo-specific NVN2 attestation.
As has been noted since the beginning, this does not mean anything is guaranteed to happen with this chip and Nintendo hardware. It would be foolish to assume nothing could change. But as far as anyone knows, that's the only chip that's on the table, we know most of its specs as of the date of the hack, and we know that it was the intended target of NVN2.
Z0m3le
Bob-omb
clock speed for sure, RAM probably not if they are releasing by may next year... semiconductor industry is sort of a mess right nowSo let’s assume that the chip is indeed “finalized” at this point in time. What has to be locked in and what can realistically change up until mass production? If I remember correctly, clock speeds and RAM? can still change.
OP
OP
Do you have the link for where T239's mentioned to seem to have the same Optical Flow Accelerator (OFA) drivers as T234?To clarify, it's not definitive, just suggestive. In January and February, they're clearly just trying to get a system booted on the virtualizer, and are definitely not working with actual hardware.

platform: tegra: cbb: add tegra239 string check · OE4T/linux-tegra-5.10@9010ae3
T239 simulator dts doesnot have tegra23x name in compatible string. So, probe is failing with error. tegra23x-cbb 13a00000.cbb-en: Wrong SOC tegra23x-cbb: probe of 13a00000.cbb-en failed with err...github.com

panels: t23x: dsi: add dtsi for dsi panels · OE4T/linux-tegra-5.10@9b985d7
This change adds dtsi files for DSI panels supported on T23x platforms: 1) Tianma DPHY Panel A - dsi-tianma-a-j1-dphy.dtsi 2) Tianma DPHY Panel B - dsi-tianma-b-j2-dphy.dtsi 3) Innolux DPHY Pane...
It's pretty dead after that, but then work picks up in March with a rash of updates to the IO drivers, which could be nothing, but this one -

mmc: tegra: Update T23x specific SoC data. · OE4T/linux-tegra-5.10@66f0c54
This patch has following changes: - Define dt compatible string "nvidia,tegra239-sdhci" to identify T239 platforms and populate T239 specific SoC data for SDMMC. - Define min/max tap dela...
- involves fixing timing quirks that are specific to T239's PCI bus. It's not definitive, but this kind of bugfix implies actual hardware.
There is just no chance T239 is unrelated to Nintendo. Or it wouldn’t be the basis for nvn2.So he's acknowledging that it's tied to NVN2 but doesn't think that means it's in any way tied to Nintendo. I guess similar to the way T234 is mentioned in the NVN2 leak?
But I'd argue that also ties T234 to Nintendo... In that early devkits likely used T234 AKA Orin.
I didn't get into it because I was in a hurry while writing that, but certainly the expectation is for the system to have BC, just that it won't look like their typical BC, both because, as you point out, things have changed, but also because all current indications are that the hardware is incapable of their traditional approach without costly extra silicon, both in terms of cost and physical size. Nintendo has unique constraints and idiosyncrasies which will shape what the BC looks like, but PS5 and XS are probably good enough starting points.I don’t think historical conditions really apply this time, because things like hardware agnostic apis weren’t a thing in the past, and they never had a partner like Nvidia.
If Nvidias ceo was serious about a 20 year partnership, he better have a plan for future bc in place.
None of the information from Linux is really specific to Nintendo, except insofar as the chip itself is. While it is likely true that Nintendo was the primary stakeholder in the design of the chip, there's currently no reason to think they'll have a complete monopoly on it based on their past dealings with Nvidia. At the very least, a new Shield (which runs Linux) using Drake is likely to materialize at some point.I wasn't expecting any Linux kernel related info to link to Nintendo, since anything Nintendo related would be closed-source and proprietary. If we managed to get Nintendo specific information from it, that'd be a big mistake on their part.
Serif
𝕽𝖊𝖓𝖊𝖌𝖆𝖉𝖊 𝕬𝖓𝖌𝖊𝖑
I don't think I said otherwise.None of the information from Linux is really specific to Nintendo, except insofar as the chip itself is. While it is likely true that Nintendo was the primary stakeholder in the design of the chip, there's currently no reason to think they'll have a complete monopoly on it based on their past dealings with Nvidia. At the very least, a new Shield (which runs Linux) using Drake is likely to materialize at some point.
Ah, I think I misread what you were saying a bit.I don't think I said otherwise.
mariodk18
Install Base Forum Namer
Also @Z0m3le you said it was about 8 weeks to ship from China, correct? Maybe it’s just me connecting random dots, but isn’t May 12 roughly 8 weeks after the end of their fiscal year? Could they want these in full production by the end of this fiscal year to be ready for a launch with Zelda?
Z0m3le
Bob-omb
About 6 weeks from March 31st to May 12th. I don't think Nintendo would miss Zelda, but I can't rule out that they could release before it. We don't knowAlso @Z0m3le you said it was about 8 weeks to ship from China, correct? Maybe it’s just me connecting random dots, but isn’t May 12 roughly 8 weeks after the end of their fiscal year? Could they want these in full production by the end of this fiscal year to be ready for a launch with Zelda?
- Pronouns
- He/Him
If I’m not mistaken, VDK would be Virtual Developer Kit.To clarify, it's not definitive, just suggestive. In January and February, they're clearly just trying to get a system booted on the virtualizer, and are definitely not working with actual hardware.
platform: tegra: cbb: add tegra239 string check · OE4T/linux-tegra-5.10@9010ae3
T239 simulator dts doesnot have tegra23x name in compatible string. So, probe is failing with error. tegra23x-cbb 13a00000.cbb-en: Wrong SOC tegra23x-cbb: probe of 13a00000.cbb-en failed with err...panels: t23x: dsi: add dtsi for dsi panels · OE4T/linux-tegra-5.10@9b985d7
This change adds dtsi files for DSI panels supported on T23x platforms: 1) Tianma DPHY Panel A - dsi-tianma-a-j1-dphy.dtsi 2) Tianma DPHY Panel B - dsi-tianma-b-j2-dphy.dtsi 3) Innolux DPHY Pane...
It's pretty dead after that, but then work picks up in March with a rash of updates to the IO drivers, which could be nothing, but this one -
mmc: tegra: Update T23x specific SoC data. · OE4T/linux-tegra-5.10@66f0c54
This patch has following changes: - Define dt compatible string "nvidia,tegra239-sdhci" to identify T239 platforms and populate T239 specific SoC data for SDMMC. - Define min/max tap dela...
- involves fixing timing quirks that are specific to T239's PCI bus. It's not definitive, but this kind of bugfix implies actual hardware.
D
Deleted member 887
Guest
It's not in a specific commit, unfortunately, I had to walk through the source. You have to enable the CONFIG_TEGRA_GRHOST_OFA flag to build the OFA driver. You can see all the instances of CONFIG_TEGRA_GRHOST_OFA here:Do you have the link for where T239's mentioned to seem to have the same Optical Flow Accelerator (OFA) drivers as T234?
Build software better, together
GitHub is where people build software. More than 100 million people use GitHub to discover, fork, and contribute to over 420 million projects.
github.com
You can see that if the OFA is enabled it loads in the T234 driver as the only backend implementation, and loads it into a generic t23x struct, which is what these drivers usually do when they want to treat T234 and T239 the same.
It is worth noting: if you ask the build config to built the Drake graphic host, it links in an object file that can't be built from the source here, and seems to be driven by a totally different build process. That's standard for NVidia's binary drivers on Linux, but that binary driver could do almost anything. However, in order to do something totally wild, there needs to be at least a generic interface for it to bind to, and the rest of the code doesn't provide one.
So at least as of August, the OFA driver provided would be the same, and seems intended to run on both Orin and Drake.
Alovon11
Like Like
- Pronouns
- He/Them
It's not in a specific commit, unfortunately, I had to walk through the source. You have to enable the CONFIG_TEGRA_GRHOST_OFA flag to build the OFA driver. You can see all the instances of CONFIG_TEGRA_GRHOST_OFA here:

Build software better, together
GitHub is where people build software. More than 100 million people use GitHub to discover, fork, and contribute to over 420 million projects.
You can see that if the OFA is enabled it loads in the T234 driver as the only backend implementation, and loads it into a generic t23x struct, which is what these drivers usually do when they want to treat T234 and T239 the same.
It is worth noting: if you ask the build config to built the Drake graphic host, it links in an object file that can't be built from the source here, and seems to be driven by a totally different build process. That's standard for NVidia's binary drivers on Linux, but that binary driver could do almost anything. However, in order to do something totally wild, there needs to be at least a generic interface for it to bind to, and the rest of the code doesn't provide one.
So at least as of August, the OFA driver provided would be the same, and seems intended to run on both Orin and Drake.

- Pronouns
- He/Him
Fun fact, the 4000 series GPUs have an average of density of around 122 million transistors per millimeter, in comparison to the Apple chips on 5 mm that have an average transistor density of 134.1 million transistors per millimeter.
I wonder if NV used the mobile libraries on the chips….
Normally, the expectation would have been around 90 million, but this is a lot denser. Thoughts @Thraktor ?
Just seems a bit odd to me that it’s so dense, granted when it’s that dense, it’s for a specific purpose I think.
I wonder if NV used the mobile libraries on the chips….
Normally, the expectation would have been around 90 million, but this is a lot denser. Thoughts @Thraktor ?
Just seems a bit odd to me that it’s so dense, granted when it’s that dense, it’s for a specific purpose I think.
Hosermess
Koopa
Nate is correct that it alone does not imply mass production has started for a launch next spring. Not that it isn’t launching then. Which is fair because Mochizuki would have had an article out if that were the case.
Maybe, but he only caught wind of the OLED because of the new screen they ordered. (Though I think it was really the other reporter he shared the byline with on the article who had the source. It seems like she's on the Samsung beat full time) And if Nintendo is going to use the same screen for Drake then there may not be any news to share...something like a jump in orders or shipping to a different spot could be anything really. And the screen source may no longer be in a position to share anymore.
OP
OP
Yeah, 8 Cortex-A78C still seems to be the most likely option in terms of CPUs. And T239 uses an Ampere based GPU.Is the consensus on the Switch 2/Pro/Whatever still T239 with 8 Cortex-A78C cores and no NVMe SSD, or has that changed? I've seen an uptake in articles about NV SoCs. Ampere GPU?
It's been a while, but I still think that an NVMe SSD makes sense.
Internal flash storage is still up in the air. But personally, I think that UFS is more likely to be used for the internal flash storage than a NVMe SSD from a cost and power consumption standpoint.
- Pronouns
- he / him
How many vacuums duct-taped together is the T239?
Regarding the "late adopters are nit the same crowd as early adopters" thing, I think it's a bit of a different situation for a machine without a real price drop. It's not a new budget crowd getting in, and people aren't expecting the next system will cost 2-3x what Switch does now. Anecdotally at the r/NintendoSwitch daily question thread there are always people asking if now is a good time to get a Switch (or upgrade to OLED) or if something new is around the corner.
Regarding the "late adopters are nit the same crowd as early adopters" thing, I think it's a bit of a different situation for a machine without a real price drop. It's not a new budget crowd getting in, and people aren't expecting the next system will cost 2-3x what Switch does now. Anecdotally at the r/NintendoSwitch daily question thread there are always people asking if now is a good time to get a Switch (or upgrade to OLED) or if something new is around the corner.
ArchedThunder
Uncle Beerus
- Pronouns
- He/Him
And it’s not like they’d need the speed of an NVMe SSD when physical games will likely still have to run off of cards.Yeah, 8 Cortex-A78C still seems to be the most likely option in terms of CPUs. And T239 uses an Ampere based GPU.
Internal flash storage is still up in the air. But personally, I think that UFS is more likely to be used for the internal flash storage than a NVMe SSD from a cost and power consumption standpoint.
Speaking of, I think I’ve asked before, but what are the theoretical speeds of the Switch game cards? I know they’re bottlenecked by the CPU, but assuming that wasn’t an issue how fast could they be?
ArchedThunder
Uncle Beerus
- Pronouns
- He/Him
Doubtful since they’d need to use internal storage with a very high capacity. Plus the physical market is still way too big to ignore.There's always the chance Nintendo could go all digital with this new machine and keep the card slot only for backwards compatibility. It's something they could easily remove later to cut costs if they go this route.
eK-XL
Rattata
- Pronouns
- He
No they wouldn't. If people want capacity they could buy more. Nintendo won't put so little in that people would get upset, but I don't think it's safe to assume they'll put as much in as most people would want.Doubtful since they’d need to use internal storage with a very high capacity. Plus the physical market is still way too big to ignore.
ArchedThunder
Uncle Beerus
- Pronouns
- He/Him
If they wanted to match the internal speed then expansion cards would likely be expensive.No they wouldn't. If people want capacity they could buy more. Nintendo won't put so little in that people would get upset, but I don't think it's safe to assume they'll put as much in as most people would want.
Either way it’s moot, cutting out the massive physical market would be incredibly dumb of Nintendo. They’d sooner make game installs required.
eK-XL
Rattata
- Pronouns
- He
Apple and Google don't sell games for their devices on physical media. When a device is portable, physical media is a big inconvenience. I'd be really surprised if Nintendo does cartridges again for this new system. If any of the big 3 is going to leave physical first, I think it'll be Nintendo.
Nintendo Is Selling More Digitally Than Physically For The First Time Ever
Nintendo Is Selling More Digitally Than Physically For The First Time Ever
ArchedThunder
Uncle Beerus
- Pronouns
- He/Him
Apple and Google don’t sell gaming devices, they sell phones and tablets that can download games off of app stores. Nobody wants a game card slot on a phone.Apple and Google don't sell games for their devices on physical media. When a device is portable, physical media is a big inconvenience. I'd be really surprised if Nintendo does cartridges again for this new system. If any of the big 3 is going to leave physical first, I think it'll be Nintendo.
Nintendo Is Selling More Digitally Than Physically For The First Time Ever
The Steam Deck is similarly digital only because it’s a PC and that is a digital platform these days, plus it’s made to be an extension of Steam.
The Switch is not comparable to a phone, tablet or portable PC.
Also digital passed physical in 2020 because of Covid lockdowns, if I’m not mistaken physical has returned to selling better. Even if it didn’t they’d still be cutting out a massive part of their market.
Demon Lizardman
Rattata
- Pronouns
- He/His
So, will the power level of the console be compared to The Series S?
- Pronouns
- He/Him
Yeah, eUFS remains the best pick from a cost/GB and power consumption measurement, which is why it's prominently used in the smartphone market and gets closer by the day to completely supplanting eMMC. The only unknown is whether they will pair that with UFS Cards externally or keep microSD cards and use them as storage only while mandating games run off internal storage (like in the Wii days).Yeah, 8 Cortex-A78C still seems to be the most likely option in terms of CPUs. And T239 uses an Ampere based GPU.
Internal flash storage is still up in the air. But personally, I think that UFS is more likely to be used for the internal flash storage than a NVMe SSD from a cost and power consumption standpoint.
The theoretical access time of a ROM is ~30ns, which is several leagues better than an SSD. The primary reasons it does not hit that blazingly-fast access time is bus speed, latency added from being externally read through pin connections and how much data can be transmitted out of the card through said pin connections. Current Switch game cards have 17 pin connections as shown here on the game card reader:Speaking of, I think I’ve asked before, but what are the theoretical speeds of the Switch game cards? I know they’re bottlenecked by the CPU, but assuming that wasn’t an issue how fast could they be?
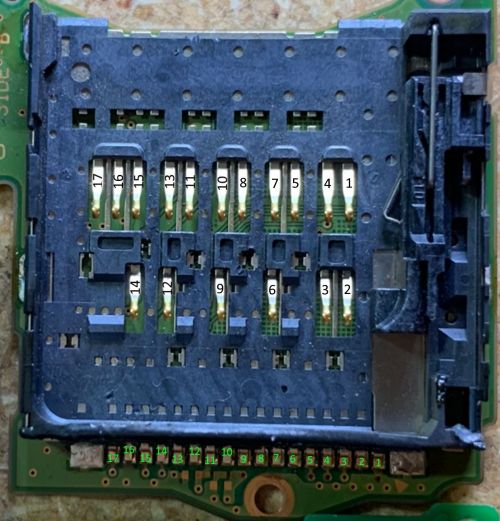
8 of those are confirmed as data bus pins, while the rest serve additional necessary functions (like card recognition, etc). An increased bus speed and more pin contact points would allow greater data transmission and would likely be adjusted to meet the same approximate read speed of whatever internal storage Nintendo uses, as Switch currently does.
Let's not suggest the last bastion of install-less gaming on physical media is going to ditch it any time soon. And they're not abandoning game cards, unless you think they're fine with an Xbox One PR fiasco (and let's not pretend it wouldn't happen, all the same reasons to be against being all-digital only from that debacle are still relevant).There's always the chance Nintendo could go all digital with this new machine and keep the card slot only for backwards compatibility. It's something they could easily remove later to cut costs if they go this route.
ArchedThunder
Uncle Beerus
- Pronouns
- He/Him
Weaker than Series S, for the most part, but games will generally be higher resolution thanks to DLSS.So, will the power level of the console be compared to The Series S?
So how costly would increasing the pin count/bus speed be? And would keeping backwards compatibility in mind change anything or is that a non issue?The theoretical access time of a ROM is ~30ns, which is several leagues better than an SSD. The primary reasons it does not hit that blazingly-fast access time is bus speed, latency added from being externally read through pin connections and how much data can be transmitted out of the card through said pin connections. Current Switch game cards have 17 pin connections as shown here on the game card reader:
8 of those are confirmed as data bus pins, while the rest serve additional necessary functions (like card recognition, etc). An increased bus speed and more pin contact points would allow greater data transmission and would likely be adjusted to meet the same approximate read speed of whatever internal storage Nintendo uses, as Switch currently does.
Last edited:
- Pronouns
- He/Him
Greater pin count would demand using something greater than the 8-bit serial interface they have used for game cards since as far back as the DS, and the interface Nintendo is using a derivative of has been in existence for... 40 years? It's just Nintendo has never needed more than they've had. Hell, they might still not need more than an 8-bit serial interface, they may just need to increase the amount of data the game card can send to RAM at any given moment, since I don't know what the current data output is on their setup now and where the bottleneck is; I'm not an electronics engineer, won't pretend to know the best way to solve the problem, but I do know it's a readily solvable problem. Going to a serial interface that can transmit more bits in the same timeframe (which would require more pins) is just one solution, but may not be necessary, is what I'm saying. In either case, a substantial cost increase should not be expected.Weaker than Series S, for the most part, but games will generally be higher resolution thanks to DLSS.
So how costly would increasing the pin count/bus speed be? And would keeping backwards compatibility in mind change anything or is that a non issue?
And, even if they do require a larger number of pin contacts on the cards, so long as the additional pins in the card reader aren't conducting electricity when a Switch card is inserted, backwards compatibility should be fine, but given how the pin contacts are arranged on Game Cards now, there's probably only a few ways to arrange additional pins.
ShadowFox08
Paratroopa
It's hard to say.. In raw power with DLSS, definitely not. With DLSS, it could match a similar performance for GPU intensive games.So, will the power level of the console be compared to The Series S?
CPU and banwidth will be the major bottlenecks for Switch Next when it comes to ports.. I think more so for latter since Switch Next's cache size and DLSS will help compensate for bandwidth.. CPU can be in the worst case scenario (assuming its 8 CPU A78) the same 3.5x speed gap between switch and ps4. Best case scenario is going to be 1.5-2.5x gap from X series s.
TonyBaduy
Moblin
- Pronouns
- He/Him
You mean 8 A78C right? Because the A78 cannot be in 1 cluster of 8 as far as their specifications go.It's hard to say.. In raw power with DLSS, definitely not. With DLSS, it could match a similar performance for GPU intensive games.
CPU and banwidth will be the major bottlenecks for Switch Next when it comes to ports.. I think more so for latter since Switch Next's cache size and DLSS will help compensate for bandwidth.. CPU can be in the worst case scenario (assuming its 8 CPU A78) the same 3.5x speed gap between switch and ps4. Best case scenario is going to be 1.5-2.5x gap from X series s.
- Pronouns
- He
Apple and Google don't sell games for their devices on physical media. When a device is portable, physical media is a big inconvenience. I'd be really surprised if Nintendo does cartridges again for this new system. If any of the big 3 is going to leave physical first, I think it'll be Nintendo.
Nintendo Is Selling More Digitally Than Physically For The First Time Ever
If Nintendo ditches cartridges I will ditch them because I cannot collect or second hand sell their products anymore. I don't think I am the only one and I think Nintendo knows.
Ultimately they would only push their customers more towards piracy.
Also, I believe Nintendo will be the last to remove physical media seeing as they differ from the rest in that they are primarily toy makers/entertainment sellers. They also have a lot more to lose when they decide to drop this.
Apple and Google have other primary incomes so it could benefit them way better. Also the entire mobile crowd is conditioned to buy apps, not collectables.
- Pronouns
- He/Him
Just three? Or over three? Bear with me, this post is going to be all over the place. At the end you’ll imagine that I’m Charlie Day and I’m insaneSpeaking of duct taping, what clocks are needed to get Drake to land in the ballpark of three PS4s?
CPU's easy enough; I'm feeling 1.6 Ghz (matching the core count and clock) could do it. For some workloads, A78 should hit triple the Jaguar's IPC, and that's the 3x right there. And of course, clocks can be pushed a bit higher if we want to cover more workloads.
I'm blanking on what's needed for the GPU though.
And why I am asking about three Playstation Four's? Change the Four to something like, I dunno, Fource or something... and when taping them together, they could be arranged in like, a triangle, I guess?

Anyway…
The Jaguar in the PS4, XB1, Pro and 1X use the same old Jaguar architecture.
Looking at the GB5 numbers for A5150, A5370, A5350 and Sempron 3850
@ 1GHz, I get: 119.375, 120.9, 120.4, 123.3. Respectively. I’ll average it out and round up.
I get 121 when normalized to 1GHz
In comparison, I found a few results of the TX1 (Android shield TV, not the switch) on GB5: 138.5, 140, 139.5, 139.6. I’ll round down for this.
So, 139 when normalized to 1GHz
(only for comparison sake)
Anyway, the PS4 only uses 6.5 cores for games on average and it’s clocked to 1.6GHz.
When figuring out the Multicore score, I noticed it didn’t translate linearly. So, I took the difference and averaged that multi core score is only 83.5% of the (single core score) x (number of cores) score…. with that said….
A theoretical score:
(121*6.5*1.6)*0.835= 1,051 as a theoretical multi core score on geekbench 5 for the PS4 of what is actually usable. Or how it actually runs with those cores. Rounded up
Similarly happens to ARM, it’s 85% for that.
So…. (139*3*1.02)*0.85= 362 as a theoretical multi core score on GB5 for the Nintendo switch of what is actually usable. Rounded up
Now…. Onto your question of 3x the PS4… well, we only have 1 sample which is the Tegra ORIN who has a 754 single core and a multi of 7773…. So it’s not stellar sample size but I’ll try to make a theoretical. There was that other video so I’ll use those numbers and try to average the two….
Normalized to the single GHz, it comes down to around 345 averaged of the 2 and rounded up.
With ORIN it is ~82% for multi like above.
So since the Drake will have 7 for games, it is a bonus going for it.
(345*7*1.6)*0.82= 3,169 theoretical score when applied to how it would actually run if at those clocks. Rounded up.
So, that’s 3.015x the PS4 in theoretical world mode….
What about the other mentioned consoles?
Glad you asked.
XBox One runs at 1.75GHz and it is also doing 6.5 Cores.. ish. PS4 Pro has 6.5 and at 2.13GHz. 1X is at 2.3GHz…
So, 1S: (121*6.5*1.75)*0.85= 1,150MT/ 212ST
Theoretical Drake(1.75) vs 1S: 3,466MT/ 604ST
Pro: 1,399MT/ 258ST
Drake(2.13): 4,219MT/ 735ST
One X: 1,511MT/ 279ST
Drake(2.3): 4,639MT/ 794ST
All of this at less than 4.5W no less (on 5N). Give or take.
PHEW! I finished the CPU theoretical Magnum opus, however, I should stress several caveats with this, first off geekbench is very memory bandwidth sensitive. The more memory bandwidth you have, the far better your score is. Second of all, geekbench is a synthetic benchmark and cannot present true real world tests to the table, even bringing things not related to gaming at all.
Third of all, this is making several assumptions to get these numbers, although they are more closer to how other people would do it to find an actual answer, we will never truly know what it is unless it is placed in that position in a real world scenario that can be observed. That is to say this is just for fun and not meant to be taken as gospel.
For the GPU though…. Drake would need to be clocked to 1.8GHz to match 3x the PS4 GPU on paper.
Edit: I also want to show something to people=
Oh and for Zen 2 in the PS5 and series, it should be this
261 single core normalized to 1GHz.
So, 914ST for the PS5
and this should be about where the MT score is with an optimized game that gets a 35% CPU uplift:
6,418MT score.
This is the closest to your real world comparison you’ll get.
I did this one specifically to show people, everyone that keeps on saying that the next generation consoles will have “significantly stronger CPU’s in every scenario to switch Drake” need to reel in their expectations with respect to those consoles. Geekbench 5 shows software that is very optimized for taking that “up to 50% perf increase from SMT” and completely for multithreaded work loads,
Well spoiler: that is completely unrealistic for games. I showed everyone here what it would be like, depending on the clock frequencies, and I kept hearing about “significantly stronger” which I had my doubts because of the caveat of the platform testing.
I hope this brings people back into a more realistic world when it comes to this. I am aware of the caveat that I mentioned about geekbench, however, if these mobile CPUs can get that close to this desktop configuration, I think people need to keep their expectations in check with respect to the CPU in the other platforms because it’s not as high as people make it seem.
Hell, a goddamn 12400 competes and does very fine against the desktop class CPUs in these consoles.
And I was generous with that 35%.
It’s more like 25% for games. They aren’t really that great scalers to large threads like that.
Last edited:
Jaytra
Rattata
Could not disagree with this statement more.If any of the big 3 is going to leave physical first, I think it'll be Nintendo.
Dude_lookinatleak
Rattata
- Pronouns
- He/Him
Just imagine for a second that Nintendo were actually using a Lovelace APU with the full DLSS 3.0 suite and RT acceleration. It would literally be the most innovative console ever released. They could literally run games at a dynamic resolution as low as 720p (Ultra Performance) at 30fps and high settings before upscaling them to 4K and interpolating the framerate to 60.There are only so many chips, even custom, that Nvidia can provide Nintendo. If it’s not T239 then everyone is back to square one. You don’t talk about dlss if it’s not this chip for instance unless Nintendo is shooting the moon w/dlss 3.0.
Would love it for AAA 3rd party releases. Hope that means Microsoft will port a few more exclusives to this new system.
thegodsend
Tektite
- Pronouns
- he/him
Just imagine for a second that Nintendo were actually using a Lovelace APU with the full DLSS 3.0 suite and RT acceleration. It would literally be the most innovative console ever released. They could literally run games at a dynamic resolution as low as 720p (Ultra Performance) at 30fps and high settings before upscaling them to 4K and interpolating the framerate to 60.
Would love it for AAA 3rd party releases. Hope that means Microsoft will port a few more exclusives to this new system.
2028.
ArchedThunder
Uncle Beerus
- Pronouns
- He/Him
What did??Well this put a damper in my enthusiasm for the next Switch.
Eclissi
Moblin
Well this put a damper in my enthusiasm for the next Switch.
Did I miss any new information?
Dark Cloud
Warpstar Knight
What happened nowWell this put a damper in my enthusiasm for the next Switch.
Nintendo is not leaving the physical market anytime soonApple and Google don't sell games for their devices on physical media. When a device is portable, physical media is a big inconvenience. I'd be really surprised if Nintendo does cartridges again for this new system. If any of the big 3 is going to leave physical first, I think it'll be Nintendo.
Nintendo Is Selling More Digitally Than Physically For The First Time Ever
I assume that Nate is not 100% sure t239 is for Nintendo.What happened now
Mr Swine
Like Like
- Pronouns
- He
What did??
Did I miss any new information?
What happened now
Basically what Hermil below says:
I assume that Nate is not 100% sure t239 is for Nintendo.
With the announcement of the new GPUs and their prices as well as the lack of true "next gen" games on PS5 and XSX, have we reached the point where developing for such powerful hardware isn't feasible anymore or is this just hangovers from Covid?
I get the sense that this industry needs a pause on chasing power and start prioritizing efficiency and utilizing what already exists. I just can't see how it's reasonable to make graphics better by throwing more money and power (literally at the PSU wattage requirements for these new cards...) at things.
I get the sense that this industry needs a pause on chasing power and start prioritizing efficiency and utilizing what already exists. I just can't see how it's reasonable to make graphics better by throwing more money and power (literally at the PSU wattage requirements for these new cards...) at things.
thegodsend
Tektite
- Pronouns
- he/him
He did say there is a high probability though - just no definite proof yet. So no need to panic.I assume that Nate is not 100% sure t239 is for Nintendo.
ArchedThunder
Uncle Beerus
- Pronouns
- He/Him
It’s almost definitely for the new Switch.Basically what Hermil below says:
Threadmarks
View all 18 threadmarks
Reader mode
Reader mode
Recent threadmarks
Poll #3: When do you think is the launch window for Nintendo's new hardware? Announcement regarding links to news and rumours from 2022 and 2021 Rough summary of the 2 August 2023 episode of Nate the Hate Rough summary of the 11 September 2023 episode of Nate the Hate Anatole's deep dive into a convolutional autoencoder Differences between T234 and T239 Rough summary of the 19 October 2023 episode of Nate the Hate necrolipe's Twitter (X) post on why a 2025 launch doesn't automatically make T239 outdated based on one of the leaked slides from Microsoft
Staff Communication
View all 13 threadmarks
Reader mode
Reader mode
Recent threadmarks
Staff Communication 05/26/23 Staff Post about Citing Leaks and Rumors Staff Post about reading Hidden Content Staff Post- Please read Keeping on topic New Switch 2 ST Made - Nontechnical Talk Has A New Home Staff Post Regarding Dubious Insiders And Better Sourcing Reminder about hide tags NewPlease read this staff post before posting.
Furthermore, according to this follow-up post, all off-topic chat will be moderated.
Furthermore, according to this follow-up post, all off-topic chat will be moderated.
Last edited: