Luminoth9090
Moblin
Credit: Welfare from InstallBase
 www.installbaseforum.com
State of the market
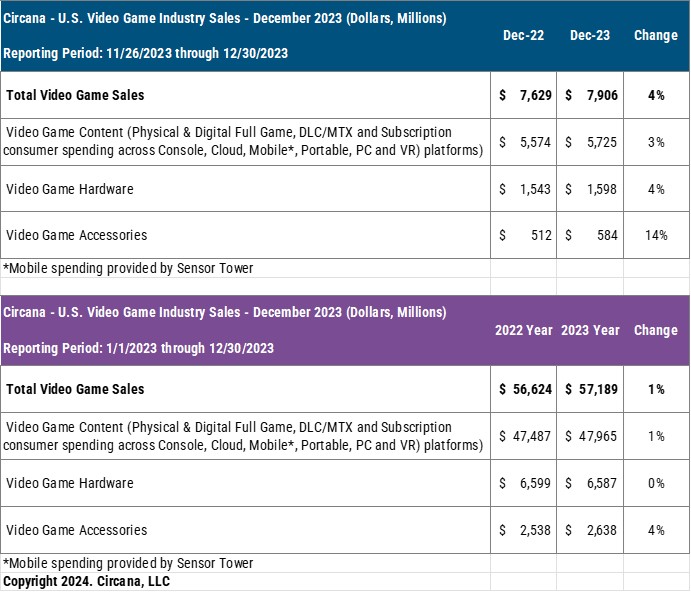
Annual U.S. spending on video game content, hardware and accessories reached $57.2 billion in 2023, an increase of 1% when compared to 2022. December spending grew 4%, to $7.9 billion.
Video game content spending ended 2023 1% higher than 2022, driven by a 13% increase in digital premium download (full game) spending on console platforms.
Hardware
Video game hardware spending ended 2023 flat vs YA, at $6.6B. Growth in PlayStation 5 hardware dollar sales helped offset declines across both Xbox Series and Switch. PlayStation 5 ended 2023 as the best-selling hardware platform in both units and dollars.
December hardware spending reached $1.6 billion, an increase of 4% when compared to December 2022. Growth in Xbox Series and PlayStation 5 hardware dollar sales offset a double-digit percentage decline for Nintendo Switch. PlayStation 5 was the best-selling hardware platform of December 2023 in both units and dollars, with Switch placing 2nd across each measure.
Dollar sales of Sony video game hardware set a new 1-month record for the manufacturer, beating the previous Sony high set in December 2022.
Software
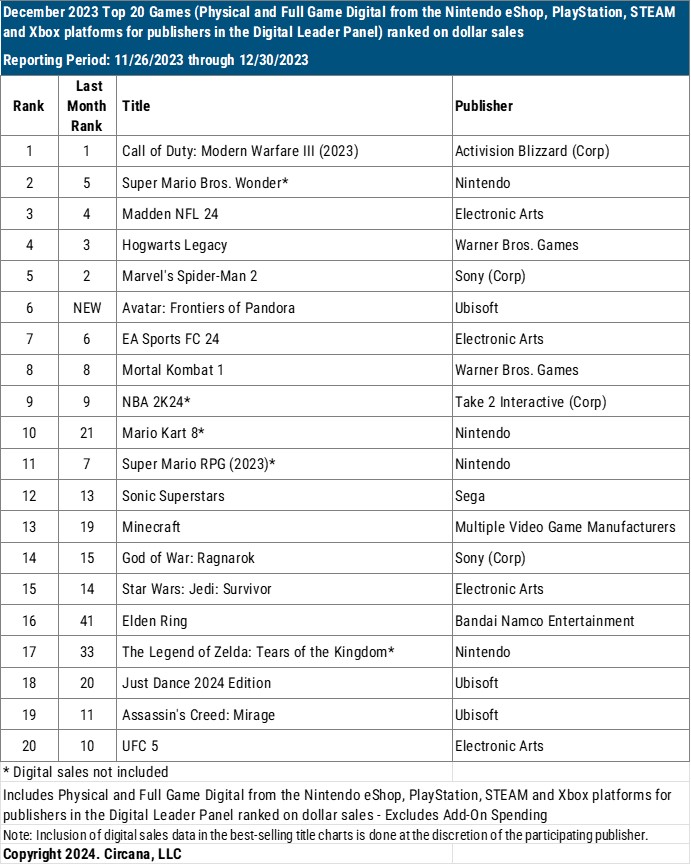
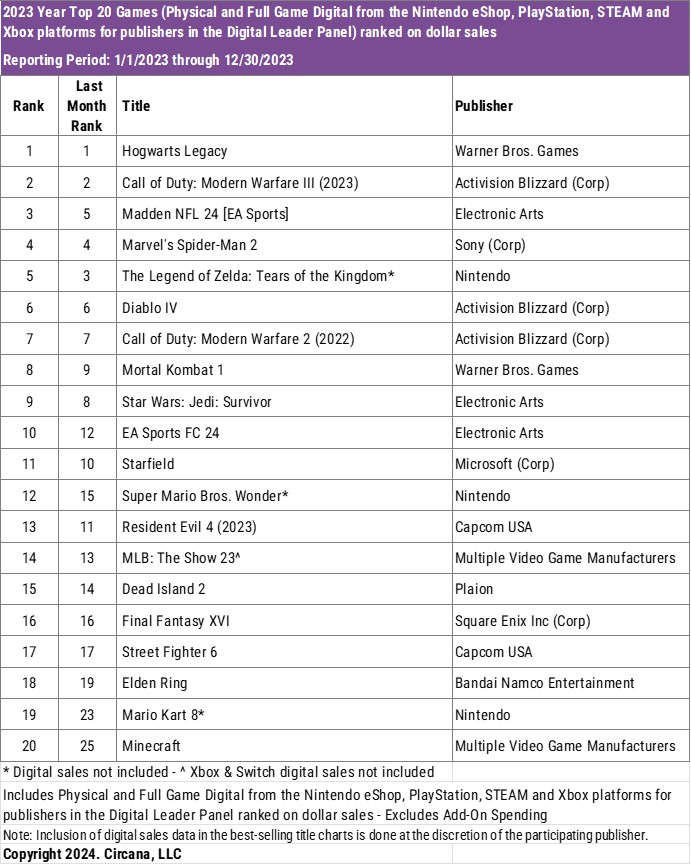
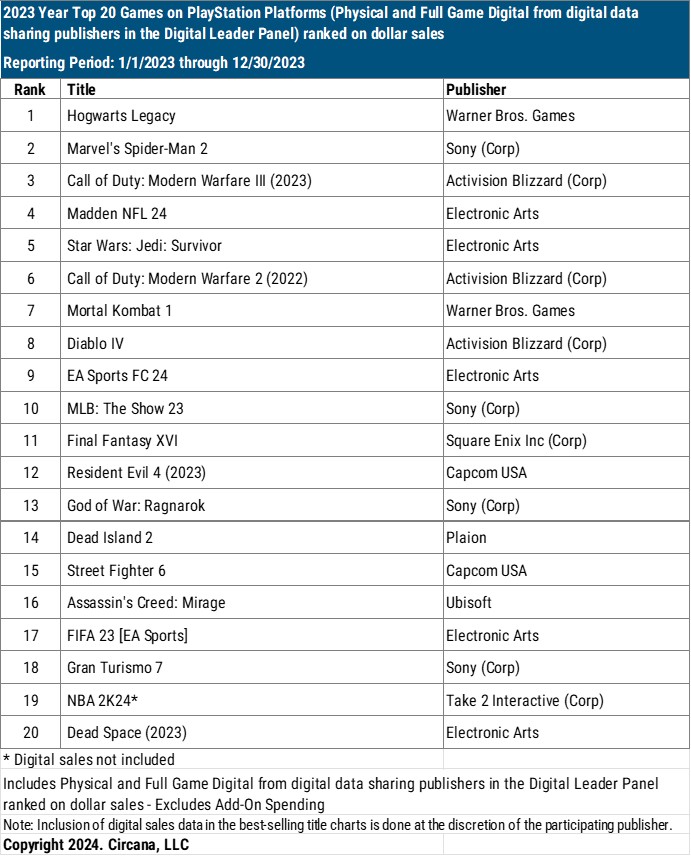
Hogwarts Legacy finished as 2023’s best-selling video game in the U.S. market in dollar sales. It is the first year since 2008 that a non-Call of Duty or Rockstar developed title ranked 1st (Rock Band).
Call of Duty: Modern Warfare III was both the best-selling game of Dec and the #2 best-selling game of 2023. Call of Duty: Modern Warfare 2 ended 2023 ranked 7th. Call of Duty was the best-selling franchise in U.S. full game dollar sales for a record 15th consecutive year.
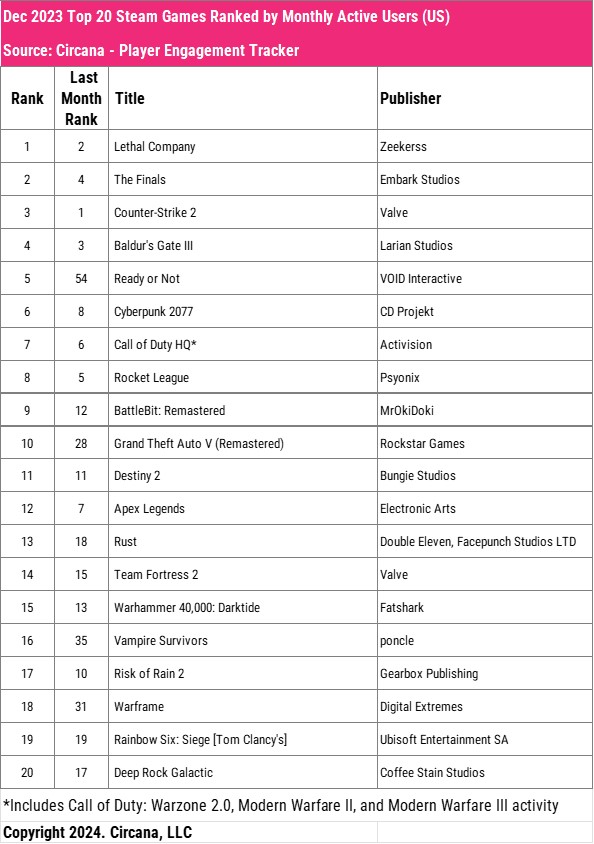
Fortnite featured the highest unique monthly active users on both PlayStation 5 and Xbox Series consoles in the US market during December, while Lethal Company ranked 1st on Steam. 36% of active PlayStation 5 players (up from 31% in Nov) and 31% of active Xbox Series players (up from 28% in Nov) played Fortnite at least once during December. (Source: Circana Player Engagement Tracker)
Inclusion in subscription offerings again helped several titles see big boosts in active user counts in Dec. On PlayStation 5, PowerWash Simulator ranked 9th in monthly active users in Dec, up from #318 in Nov. On Xbox Series consoles, Goat Simulator bounded from 245th to 7th.
Mobile
Sensor Tower reports the top 10 mobile games by U.S. spend in Dec and rank chg vs Nov as: MONOPOLY GO!, Royal Match, Roblox, Candy Crush Saga, Clash of Clans (+9), Coin Master (-1), Evony (+2), Pokémon GO (-2), Call of Duty: Mobile (+3) and Jackpot Party – Casino Slots (-3).
“US mobile gaming consumer spend in December 2023 showed yet another modest increase (+2.7%) compared to December 2022," said Samuel Aune of Sensor Tower. "...while the top four (games) continue to be stable with MONOPOLY GO! on top, Clash of Clans made a huge run this month, moving up 9 ranks,” said Aune. “Clash of Clans wasn’t the only winner this month, with all the top ten showing revenue growth in Dec relative to Nov."
The top 10 mobile games by U.S. consumer spending in 2023 according to Sensor Tower were: MONOPOLY GO!, Candy Crush Saga, Roblox, Royal Match, Coin Master, Pokémon GO, Gardenscapes, Jackpot Party – Casino Slots, Township and Evony.
Accessories
Accessories spending finished the year 4% higher than a year ago, at $2.6 billion. A 7% increase in sales of Gamepads drove the growth. The PS5 Dual Sense Edge was the best-selling gamepad of 2023 in dollar sales.
December 2023 accessories spending was 14% higher than in December 2022, at $584 million. 21% growth in December sales of Gamepads was the primary reason for the increase. December Headset/Headphone spending grew by 5% year-on-year.
Software Charts
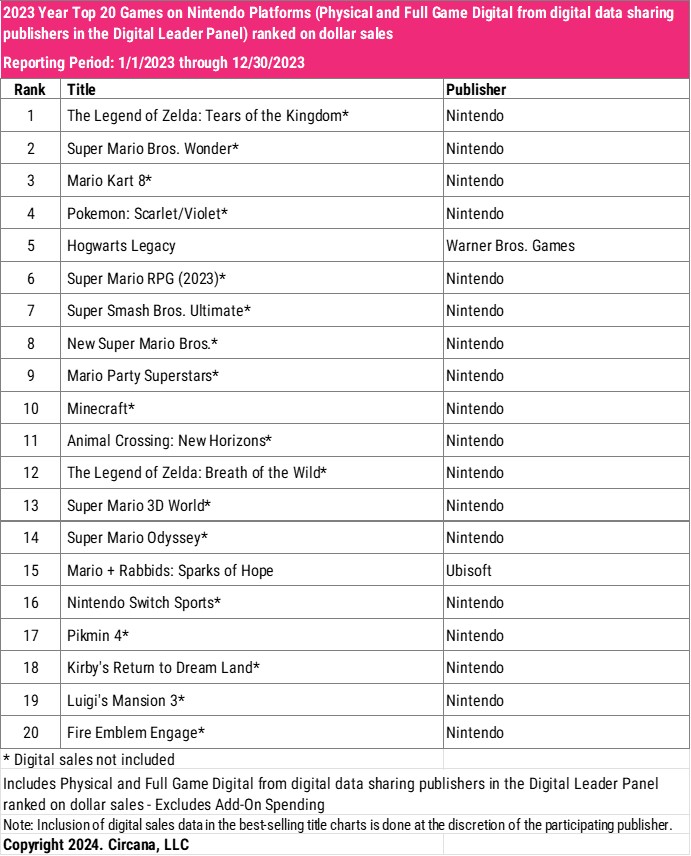
Year To Date

Monthly Active User Engagement
November 2023 Top 20 Games Played on PlayStation 5 Ranked by Monthly Active Users (US)

November 2023 Top 20 Games Played on Xbox Series Ranked by Monthly Active Users (US)

November 2023 Top 20 Games Played on Steam Ranked by Monthly Active Users (US)
Rankings
Units: PS5 > NSW > XBS
Revenue: PS5 > NSW > XBS
YTD Units: PS5 > NSW > XBS
YTD Revenue: PS5 > NSW > XBS
Thanks Mat Piscatella!
PS5 is a minimum of 10% up yoy (from 1331K), XBS had it's best December so it is above Dec 2021 (1076K) and Switch is a minimum of 10% down yoy (from 1490K).
Unit Sales
PS5 - > 1464K
NSW - < 1341K > XBS
XBS - > 1076K
Welfare's Estimate's
PS5 - 1530K
NSW - 1250K
XBS - 1130K

Circana December 2023: #1 COD MWIII #2 Mario Wonder #3 Madden; PS5 #1 Units + Revenue, Switch #2 Units + Revenue
State of the market
Annual U.S. spending on video game content, hardware and accessories reached $57.2 billion in 2023, an increase of 1% when compared to 2022. December spending grew 4%, to $7.9 billion.
Video game content spending ended 2023 1% higher than 2022, driven by a 13% increase in digital premium download (full game) spending on console platforms.

Hardware
Video game hardware spending ended 2023 flat vs YA, at $6.6B. Growth in PlayStation 5 hardware dollar sales helped offset declines across both Xbox Series and Switch. PlayStation 5 ended 2023 as the best-selling hardware platform in both units and dollars.
December hardware spending reached $1.6 billion, an increase of 4% when compared to December 2022. Growth in Xbox Series and PlayStation 5 hardware dollar sales offset a double-digit percentage decline for Nintendo Switch. PlayStation 5 was the best-selling hardware platform of December 2023 in both units and dollars, with Switch placing 2nd across each measure.
Dollar sales of Sony video game hardware set a new 1-month record for the manufacturer, beating the previous Sony high set in December 2022.
Software
Hogwarts Legacy finished as 2023’s best-selling video game in the U.S. market in dollar sales. It is the first year since 2008 that a non-Call of Duty or Rockstar developed title ranked 1st (Rock Band).
Call of Duty: Modern Warfare III was both the best-selling game of Dec and the #2 best-selling game of 2023. Call of Duty: Modern Warfare 2 ended 2023 ranked 7th. Call of Duty was the best-selling franchise in U.S. full game dollar sales for a record 15th consecutive year.
Fortnite featured the highest unique monthly active users on both PlayStation 5 and Xbox Series consoles in the US market during December, while Lethal Company ranked 1st on Steam. 36% of active PlayStation 5 players (up from 31% in Nov) and 31% of active Xbox Series players (up from 28% in Nov) played Fortnite at least once during December. (Source: Circana Player Engagement Tracker)
Inclusion in subscription offerings again helped several titles see big boosts in active user counts in Dec. On PlayStation 5, PowerWash Simulator ranked 9th in monthly active users in Dec, up from #318 in Nov. On Xbox Series consoles, Goat Simulator bounded from 245th to 7th.
Mobile
Sensor Tower reports the top 10 mobile games by U.S. spend in Dec and rank chg vs Nov as: MONOPOLY GO!, Royal Match, Roblox, Candy Crush Saga, Clash of Clans (+9), Coin Master (-1), Evony (+2), Pokémon GO (-2), Call of Duty: Mobile (+3) and Jackpot Party – Casino Slots (-3).
“US mobile gaming consumer spend in December 2023 showed yet another modest increase (+2.7%) compared to December 2022," said Samuel Aune of Sensor Tower. "...while the top four (games) continue to be stable with MONOPOLY GO! on top, Clash of Clans made a huge run this month, moving up 9 ranks,” said Aune. “Clash of Clans wasn’t the only winner this month, with all the top ten showing revenue growth in Dec relative to Nov."
The top 10 mobile games by U.S. consumer spending in 2023 according to Sensor Tower were: MONOPOLY GO!, Candy Crush Saga, Roblox, Royal Match, Coin Master, Pokémon GO, Gardenscapes, Jackpot Party – Casino Slots, Township and Evony.
Accessories
Accessories spending finished the year 4% higher than a year ago, at $2.6 billion. A 7% increase in sales of Gamepads drove the growth. The PS5 Dual Sense Edge was the best-selling gamepad of 2023 in dollar sales.
December 2023 accessories spending was 14% higher than in December 2022, at $584 million. 21% growth in December sales of Gamepads was the primary reason for the increase. December Headset/Headphone spending grew by 5% year-on-year.
Software Charts

Year To Date


Monthly Active User Engagement
November 2023 Top 20 Games Played on PlayStation 5 Ranked by Monthly Active Users (US)

November 2023 Top 20 Games Played on Xbox Series Ranked by Monthly Active Users (US)

November 2023 Top 20 Games Played on Steam Ranked by Monthly Active Users (US)

Rankings
Units: PS5 > NSW > XBS
Revenue: PS5 > NSW > XBS
YTD Units: PS5 > NSW > XBS
YTD Revenue: PS5 > NSW > XBS
Thanks Mat Piscatella!
PS5 is a minimum of 10% up yoy (from 1331K), XBS had it's best December so it is above Dec 2021 (1076K) and Switch is a minimum of 10% down yoy (from 1490K).
Unit Sales
PS5 - > 1464K
NSW - < 1341K > XBS
XBS - > 1076K
Welfare's Estimate's
PS5 - 1530K
NSW - 1250K
XBS - 1130K
Last edited:


