• Hey everyone, staff have documented a list of banned content and subject matter that we feel are not consistent with site values, and don't make sense to host discussion of on Famiboards. This list (and the relevant reasoning per item) is viewable here.

Discussion 20 Years of Nintendo console sales

Kahhhhyle

Rattata
Pronouns
He/Him
I stumbled onto this article while I was crafting a reply on era lol. It feels like something famiboards would find interesting.

I'm sure some of you have already seen it, but I wanted to share it as just interesting info for Nintendo's history up to 2020 while we look forward to what's next.

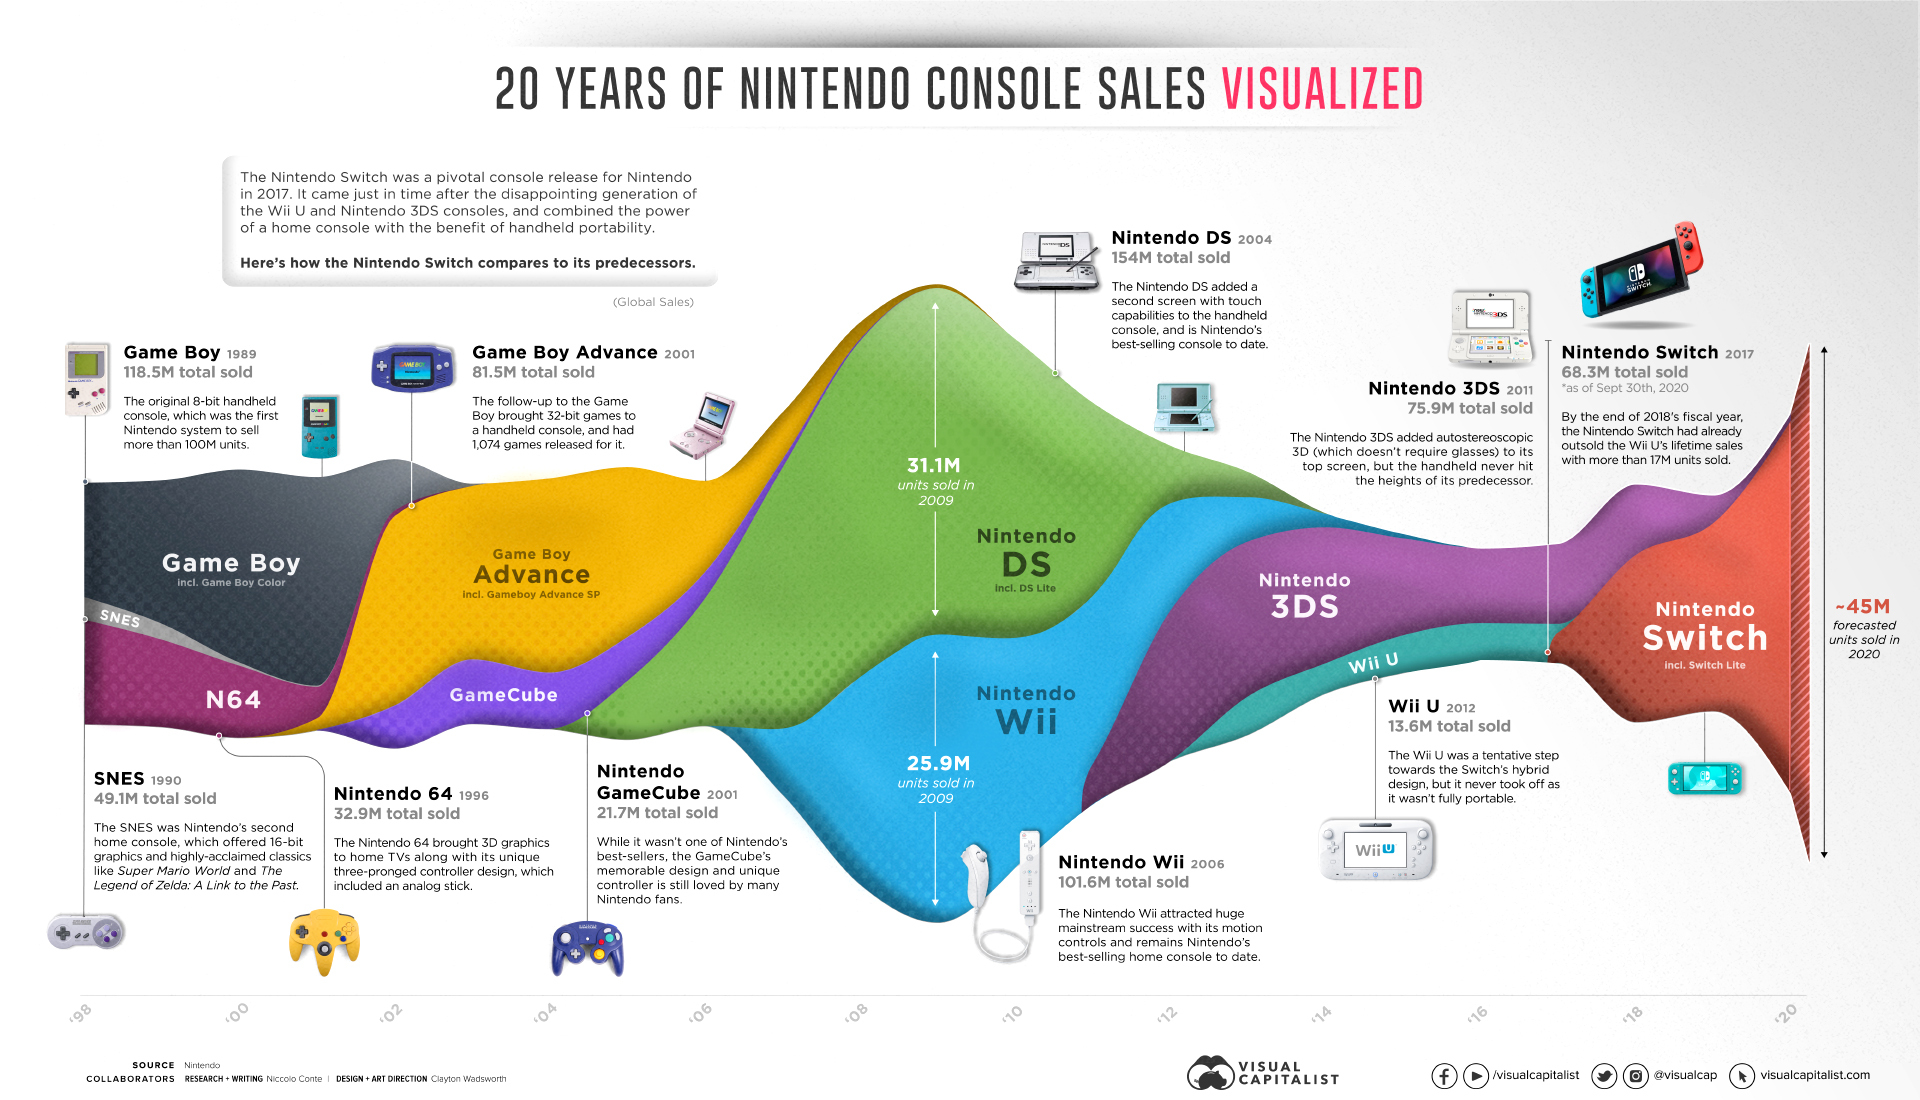
How the Nintendo Switch Brought Console Sales Back​

Since its 2017 release, the Nintendo Switch has become a household game console for gamers and non-gamers alike.

Few consoles penetrate the mainstream deeply enough to have parents referring to a console by its proper name, instead of their children’s “Gameboy” or “Wii”. Even fewer come together as a complete package that ties together the ideologies and technical ideas of their preceding consoles like the Nintendo Switch has.

This graphic visualizes the Nintendo Switch sales success story alongside more than 20 years of Nintendo console sales.
20-years-of-nintendo-console-sales.jpg
 
I definitely remember seeing this before and I love the visualization, but the very end kind of faceplants when it tries to forecast a year of 45 million Switch sales.

FWIW, in my Garaph databases where the shipment data is about the only thing kept updated, I have some similar "overall" values in less beautiful form but easier to take a close look at. NH_WW is Nintendo Home Worldwide, NP_WW is Nintendo Portable Worldwide, NSW_WW is Switch Worldwide (it's a bit premature to have a Nintendo Hybrid value), and NA_WW is Nintendo All Worldwide. Also software versions.
HqY46Yz.png

BG9An2R.png
 
It starts at ‘98 and ends at 2020… that’s 22 years
Perhaps we're looking at different images, because the one that I see in the OP starts in 1989 when the Gameboy came out (and the NES is not included for whatever reason), and goes until a forecasted 2020. That would be 31 years.
 
Perhaps we're looking at different images, because the one that I see in the OP starts in 1989 when the Gameboy came out (and the NES is not included for whatever reason), and goes until a forecasted 2020. That would be 31 years.
It doesn't though? It starts at 98
 
It doesn't though? It starts at 98
Umm... so it's starting in 1998? The year the Gameboy Color came out? I guess we could keep going back and forth like this but instead I'll just copy the image I'm referencing:

years of Nintendo console sales.
20-years-of-nintendo-console-sales.jpg
Seems pretty definitively starting in 1989 when the original Gameboy came out. Not 1998 when the Gameboy Color came out.
 
Umm... so it's starting in 1998? The year the Gameboy Color came out? I guess we could keep going back and forth like this but instead I'll just copy the image I'm referencing:


Seems pretty definitively starting in 1989 when the original Gameboy came out. Not 1998 when the Gameboy Color came out.

I don't think you are reading the graph right.

1989 is just the launch date of the GameBoy. Graph starts at a moment in time where the GameBoy, the SNES and the N64 were selling at the same moment in time. The N64 wasn't a thing in 1989. So if you check the timeline at the very bottom it says... '98.
 
0
Umm... so it's starting in 1998? The year the Gameboy Color came out? I guess we could keep going back and forth like this but instead I'll just copy the image I'm referencing:


Seems pretty definitively starting in 1989 when the original Gameboy came out. Not 1998 when the Gameboy Color came out.
The graph starts in 98. Look at the x axis, the actual timeline.

The GB and SNES are shown as they were out at that point in time, with the number next to them indicating their years of release.
 
The graph starts in 98. Look at the x axis, the actual timeline.

The GB and SNES are shown as they were out at that point in time, with the number next to them indicating their years of release.
Having the total lifetime sales under the name of each console makes it really confusing
 
0
Perhaps we're looking at different images, because the one that I see in the OP starts in 1989 when the Gameboy came out (and the NES is not included for whatever reason), and goes until a forecasted 2020. That would be 31 years.
IMG-6199.jpg

Here’s the image I’m looking at, with 98 circled. Please show me what image you’re looking at?

The leftmost part of the graph shows Game Boy, N64 and SNES all being sold at the same time. Since when were the N64 and SNES being sold in ’89?
 
I guess what makes it extra confusing is the Game Boy Color is clearly not placed closely to its actual release on the chart - they do that kind of arbitrarily across the graph
 
0
The graph starts in 98. Look at the x axis, the actual timeline.

The GB and SNES are shown as they were out at that point in time, with the number next to them indicating their years of release.
Ah I see now. That's easy to miss on a phone with a lack of sleep, I guess. Thanks though, now this whole graph makes sense and ruins my initial joke.
 
IMG-6199.jpg

Here’s the image I’m looking at, with 98 circled. Please show me what image you’re looking at?

The leftmost part of the graph shows Game Boy, N64 and SNES all being sold at the same time. Since when were the N64 and SNES being sold in ’89?
Well this image only goes from '98 to '08. That's... only 10 years by my calculations.


Back
Top Bottom